- Create a new dataset (new or edc). Choose pulse program zg30 to record a conventional 1H spectrum. Choose your own folder.
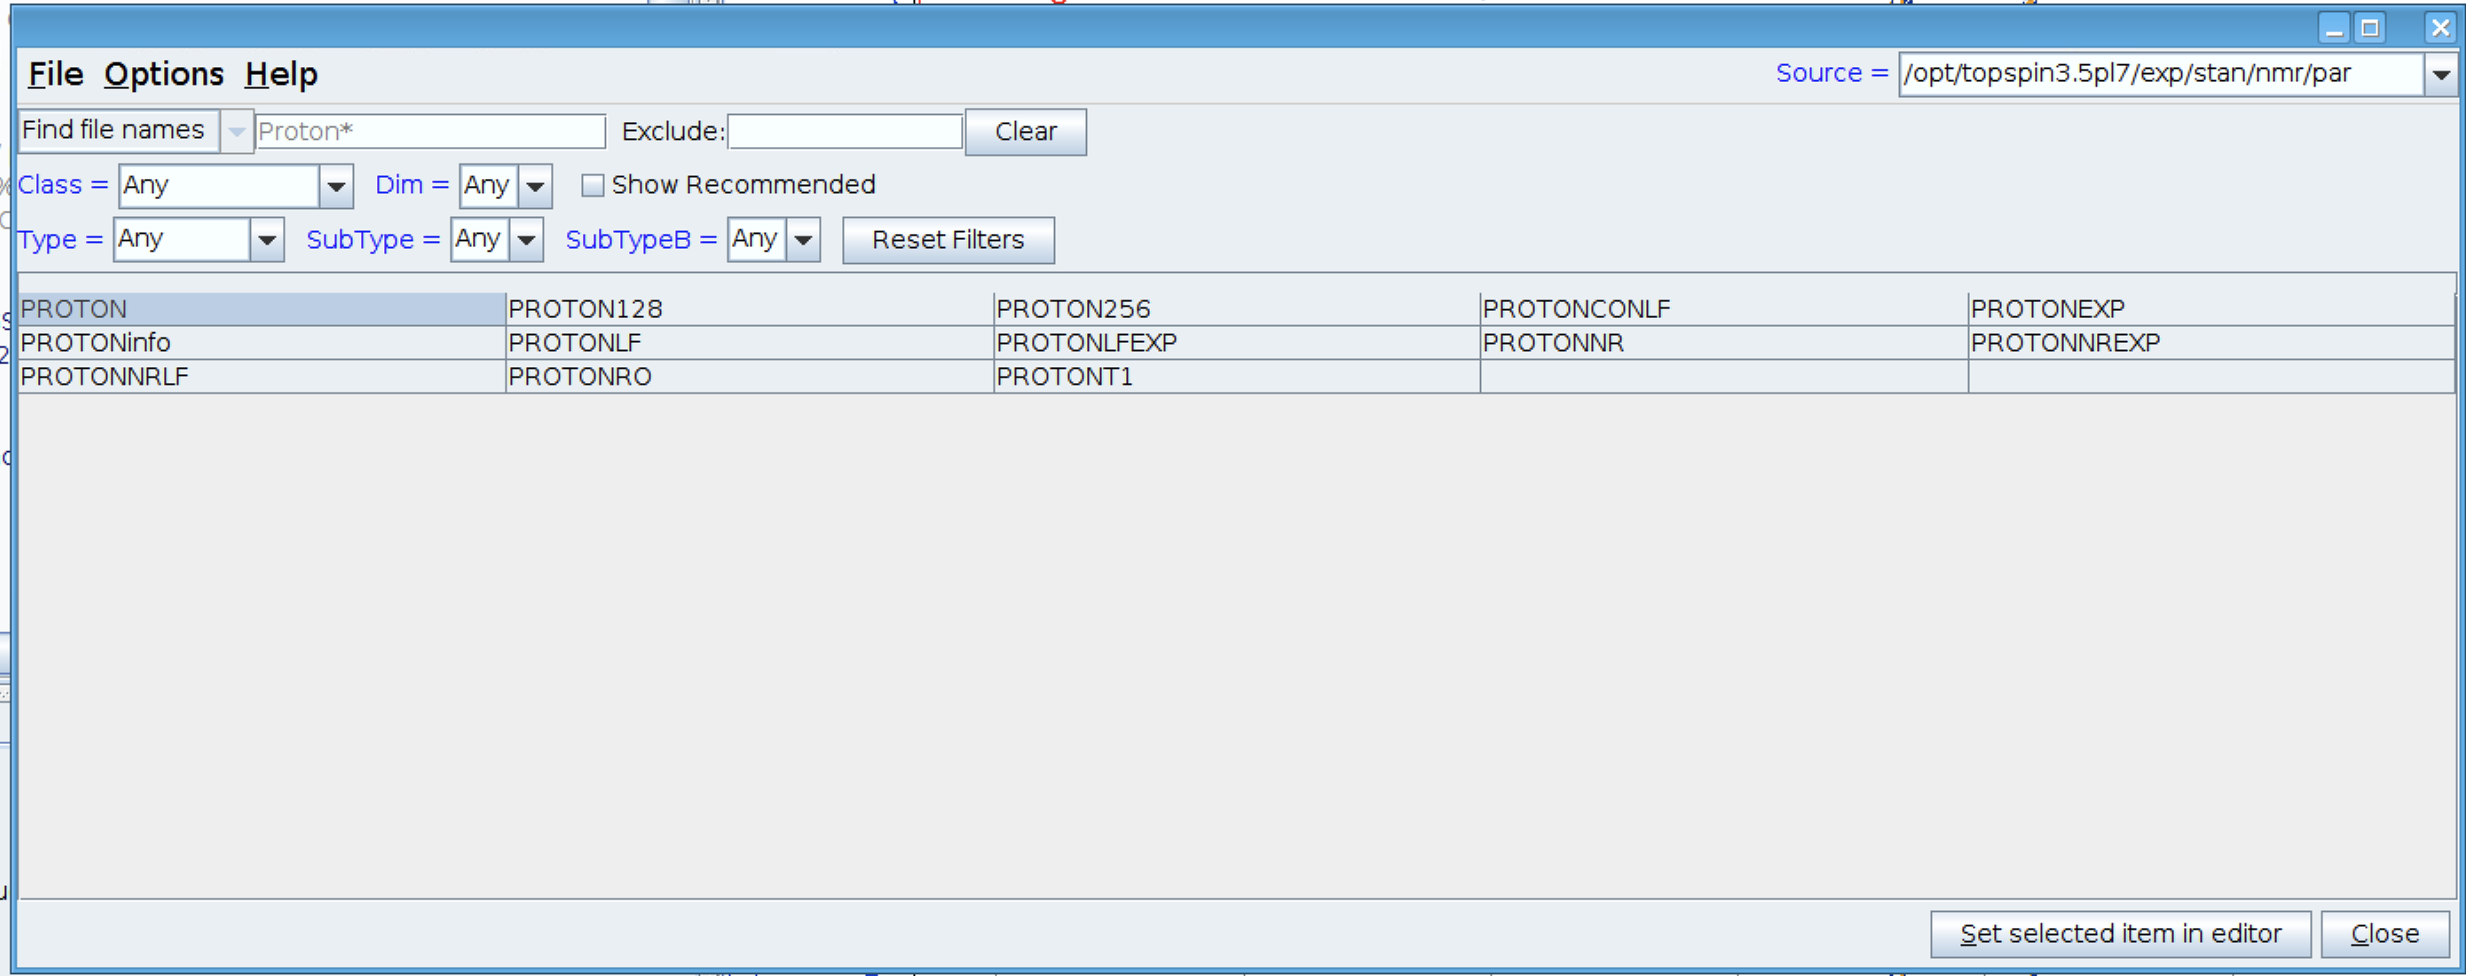
- Type rpar PROTON all or Select PROTON.
- Type getprosol: gets probe and solvent dependent parameters from the edprosol table.
- Set the offset to 4.7 ppm (H2O + D2O)
- Calculate the receiver gain by typing rga.
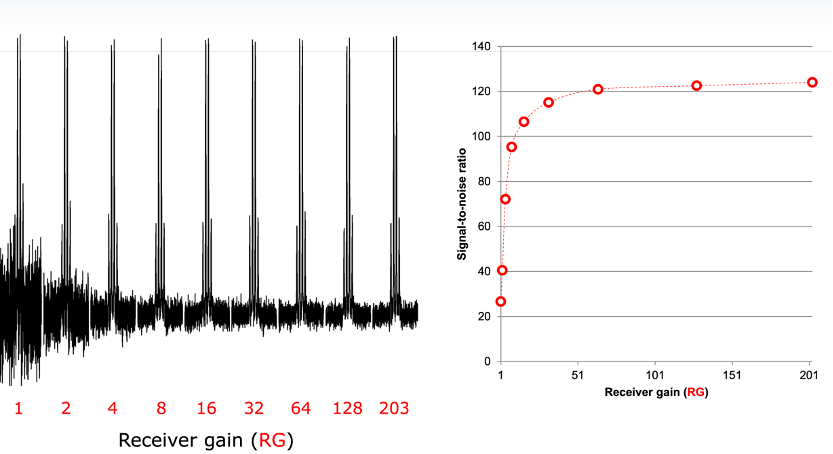
Obs: Higher RG values will improve S/N (up to a certain RG value). Too high RG will result in distorted spectra.
- Record a conventional 1H spectrum. Note the frequency (o1) of the solvent resonance.
- Relaxation delay (1-5*T1) (d1): 1s
- Number of scans (ns): 2
- Dummy scans (ds): 2
Dummy scans are scans during which no fid is accumulated. Other than that, they are identical to normal scans, which means they take the same time (AQ) and perform phase cycling. Dummy scans are used to reach steady state conditions concerning T1 relaxation. Furthermore, they are used to establish a stable temperature.
Spectral Width (sw in ppm) 20.8
Center of spectrum (o1p in ppm): 4.700
Time Domain (TD) 32k. TD. Number Of Raw Data Points
The parameter TD determines the number of raw data points to be acquired. A large value of TD enhances the spectrum resolution (necessary for small molecules), but also increases the acquisition time AQ. TD is usually set to a power of 2, for example 64k for a 1D spectrum, which corresponds to 65536 points. The FID resolution is related to the number of data points according to:
FIDRES=SW*SFO1/TD

