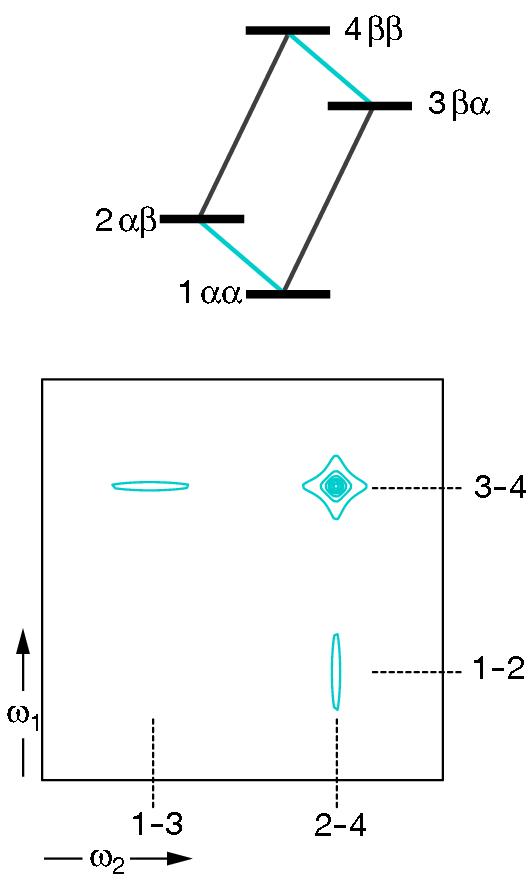
At higher magnetic fields 15N relaxation is dominated by chemical shift anisotropy (CSA) and Dipole-dipole (DD), which leads to increase of the overall transverse relaxation rates with increasing magnetic field, B0. The TROSY (Transverse Relaxation Optimized SpectroscopY) experiment utilizes the fact that cross-correlated relaxation interference, caused by CSA and DD, are different for the individual multiplet components in a system of two scalar-coupled spins 1/2, such as an isolated weakly coupled 15N-1H fragment of a peptide bond. It is worth mentioning that CSA has the same effect on the T2 relaxation of all multiplet components. In contrast, the effect of DD on the T2 relaxation of the resonances from the β transitions is opposite to the effect from the CSA. Consequently, the line widths originating from the β transitions are reduced and those from the α are broadened, check the Figure below.
The TROSY pulse sequence the scalar coupling evolution is not refocused during t1 and t2, and it uses phase cycling to obtain a pure absorptive spectrum containing only the most slowly relaxing component of the two-dimensional multiplets.
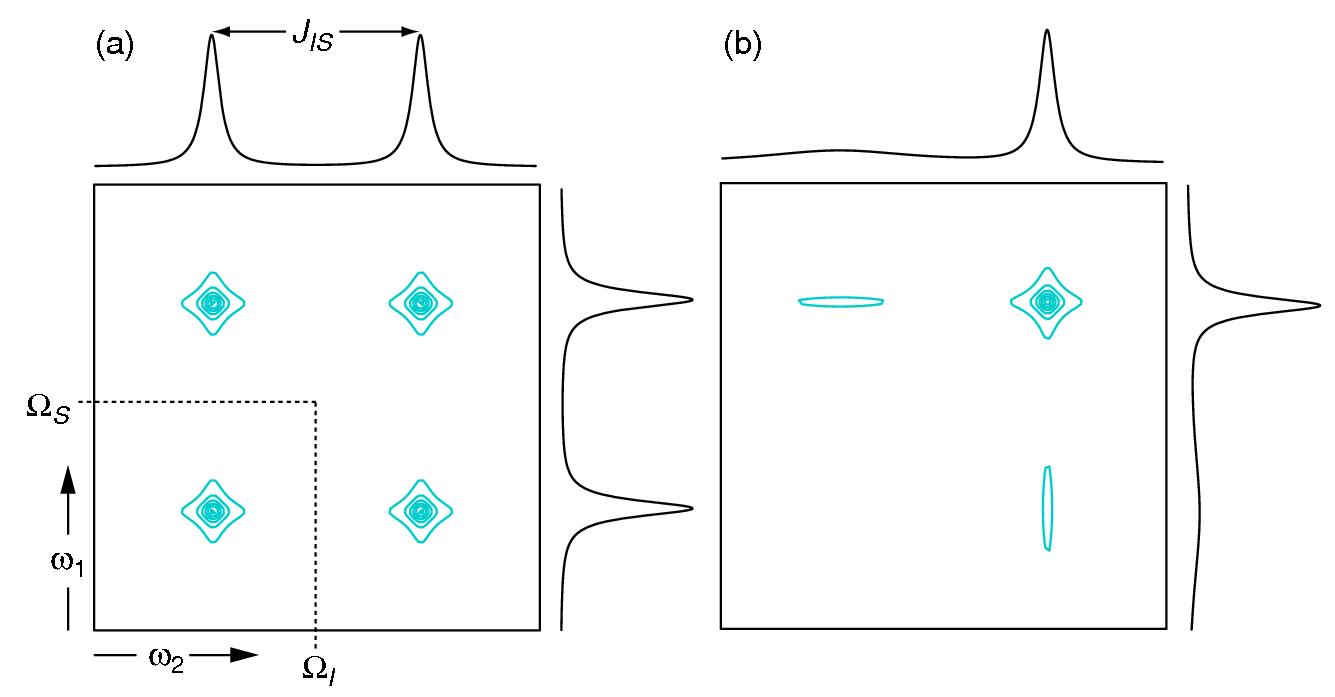
The TROSY effect is particularly important for studies of large molecular weight proteins (> 25 kDa) at high static magnetic field strengths (> 14.1 Tesla). In the Figure below, we have a fully-coupled 15N-HSQC for a small protein – up to 20 kDa (a) and a large protein (b). It is clear that for the small protein is quite advantageous to acquire a regular 15N-HSQC once this results in a single peak that is the sum of four sharp peaks. However, the sum of the four transitions will result in a broad peak for the large protein. Therefore, TROSY versions of pulse sequences are the best choice if you identify these differences in T2 relaxation in your system. Finally, you can get better results by combining TROSY and deuterated protein (changing 1H for 2H reduces DD interaction).
In terms of the pulse sequence, there are dozens of options in the literature and Bruker’s pulse sequence list. I’ve tried several Bruker ones, and the pulse sequence that showed the best signal/noise was trosyetf3gpsi. When selecting a pulse sequence, try acquiring the first increment of different pulse sequences and check which gives the best results. Also, test different 1JNH values (90, 95, 100 Hz).
In terms of the pulse sequence, there are dozens of options in the literature and Bruker’s pulse sequence list. I’ve tried several Bruker ones, and the pulse sequence that showed the best signal/noise was trosyetf3gpsi. When selecting a pulse sequence, try acquiring the first increment of different pulse sequences and check which gives the best results. On the non-standard side, the group of professor Gianluigi Veglia published the implementation of an excellent water suppression method on a TROSY pulse sequence (WADE-TROSY-HSQC) that presented a significant improvement of signal/noise; for more information, check the paper and the SI:
https://pubs.rsc.org/en/content/articlelanding/2022/CP/D2CP01744J
https://www.rsc.org/suppdata/d2/cp/d2cp01744j/d2cp01744j1.pdf .
Click in the link below to check a comparison of wade-trosy & trosyetf3gpsi –> same number of scans (NS=16), RG = 203..
References:
Pervushin et al. in Proc Natl Acad Sci USA 94:12366-12371, 1997.
Kay LE, Gardner KH (1997) Curr Opin Struct Biol 7:722

